FuncTree2 Documentation
FuncTree2 allows you to visualize and explore omics data in the hierarchical context of biological ontologies. Mapping omics data onto a pre-defined interactive treemap, based on the KEGG Brite, FOAM or your own functional hierarchy, lets you quickly and comprehensively understand the functional potential of your data, which will help you develop further hypothesis and scientific insights. Statistical tests, module pathway reconstruction, and different customization controls are built-in to help you in your quest.
Here you will learn about the different types of analysis available in FuncTree2 and the accepted data formats. We also give you some usage tips and a sneak preview of what your output will look like.
Data format
Tab separated matrices
| Annotation | Sample1 | Sample2 | Sample3 | .. | sampleN |
|---|---|---|---|---|---|
| K00001 | 1 | 2 | 5 | .. | 10 |
| K00002 | 1 | 2 | 9 | .. | 10 |
| K00302 | 31 | 7 | 12 | .. | 0 |
| .. | .. | .. | .. | .. | .. |
| K00107 | 21 | 14 | 11 | .. | 170 |
A Tab separated Omics matrix, annotated with one of the following ontology databases is accepted:
- KEGG KO
- KEGG Modules
- KEGG Reactions
- KEGG Genes
- STRING proteins
- COGs/eggNOGGs
- EC numbers (EC:1.1.1.1)
- Carbohydrate-Active enZYmes (CAZY:GT35)
- Gene Ontology terms (GO:0004022)
- Uniprot IDs (UNIPROT:C1MSP6)
- NCBI Gene IDs (NCBI-GI:100000006)
In addition an optional Tab separated color list could be uploaded to color associated annotations in circle mode .
Display color list snippet Full example| Annotation | Color |
|---|---|
| Translation | #ff0000 |
| map03010 | #ff0000 |
| .. | .. |
| Sample2 | #ffffff |
JSON
Processed datasets could be exported in JSON format and re-uploaded later to FuncTree2. Below is an example of a valid JSON file and its schema definition.
[
  {
    "profile_id": {
      "$uuid": "3699bc84d98047498eb0d9c11d8c1667"
    },
    "added_at": {
      "$date": 1514992108907
    },
    "description": "Demo data",
    "expire_at": {
      "$date": 1517584108907
    },
    "private": true,
    "target": "KEGG",
    "series": [
      "Abundance (Mean)",
      "Abundance (Summation)"
    ],
    "columns": [
      [
        "sample1",
        "sample2",
        "sample3"
      ],
      [
        "sample1",
        "sample2",
        "sample3"
      ]
    ],
    "colors": [],
    "profile": [
      {
        "entry": "KEGG BRITE Functional Hierarchies",
        "layer": "brite0",
        "values": [
          [
            6.5175564073086971E-05,
            6.4689630192770909E-05,
            5.3407823327669461E-05
          ],
          [
            1.5576959813467786,
            1.5460821616072249,
            1.2764469775313
          ]
        ]
      },
      {
        "entry": "Metabolism",
        "layer": "brite1",
        "values": [
          [
            0.00017161420380480775,
            0.00017776841890616461,
            0.00014436526840806463
          ],
          [
            0.91092819379591949,
            0.94359476755392169,
            0.76629084471000708
          ]
        ]
      },
      {
        "entry": "Carbohydrate metabolism",
        "layer": "brite2",
        "values": [
          [
            0.00025415234933120779,
            0.00028111102108846925,
            0.00020965832957411891
          ],
          [
            0.2912585923335641,
            0.32215323016738578,
            0.24026844569194028
          ]
        ]
      },
      {
        "entry": "map04014",
        "layer": "pathway",
        "values": [
          [
            3.6557935185333328E-06,
            4.4144293041603332E-06,
            2.9857353651650658E-07
          ],
          [
            0.00054836902777999992,
            0.00066216439562404993,
            4.4786030477475986E-05
          ]
        ]
      },
      {
        "entry": "M00687",
        "layer": "module",
        "values": [
          [
            1.1073911E-05,
            1.5440517E-05,
            3.1061942857142854E-07
          ],
          [
            7.7517377E-05,
            0.000108083619,
            2.174336E-06
          ]
        ]
      },
      {
        "entry": "K05092",
        "layer": "ko",
        "values": [
          [
            8.7106E-08,
            2.17858E-07,
            1.3960600000000002E-08
          ],
          [
            8.7106E-08,
            2.17858E-07,
            1.3960600000000002E-08
          ]
        ]
      },
      {
        "entry": "K05096",
        "layer": "ko",
        "values": [
          [
            4.99277E-07,
            1.81587E-06,
            3.42305E-08
          ],
          [
            4.99277E-07,
            1.81587E-06,
            3.42305E-08
          ]
        ]
      }
    ]
  }
]
{
  "$schema": "http://json-schema.org/draft-07/schema#",
  "title": "Profile",
  "description": "A FuncTree customization profile",
  "type": "object",
  "properties": {
    "profile_id": {
      "description": "A unique identifier for the profile",
      "type": "object",
      "properties": {
        "$uuid": {
          "description": "A unique identifier for the profile",
          "type": "integer"
        }
      }
    },
    "added_at": {
      "description": "Creation date of the profile",
      "type": "object",
      "properties": {
        "$date": {
          "description": "Creation date of the profile",
          "type": "integer"
        }
      }
    },
    "expire_at": {
      "description": "Scheduled deletion of the profile from FuncTrees storage",
      "type": "object",
      "properties": {
        "$date": {
          "description": "Scheduled deletion of the profile from FuncTrees storage",
          "type": "integer"
        }
      }
    },
    "description": {
      "description": "Description of the profile",
      "type": "string"
    },
    "private": {
      "description": "Keep the profile private",
      "type": "boolean"
    },
    "target": {
      "description": "Target database hierarchy",
      "type": "string"
    },
    "series": {
      "description": "Type of the matrices summarized in the profile:values arrays",
      "type": "array",
      "items": {
        "type": "string"
      }
    },
    "profile": {
      "description": "The customization values for a FuncTree instance",
      "type": "array",
      "items": {
        "type": "object",
        "properties": {
          "entry": {
            "description": "Entry id for example K number or Module ids...",
            "type": "string"
          },
          "layer": {
            "description": "Layer of the object e.g. KO, Module or Pathway",
            "type": "string"
          },
          "values": {
            "description": "Series customization numeric values",
            "type": "array",
            "items": {
              "type": "array",
              "items": {
                "type": "number"
              }
            }
          }
        }
      }
    },
    "columns": {
      "description": "Series column names",
      "type": "array",
      "items": {
        "type": "array",
        "items": {
          "type": "string"
        }
      }
    },
    "colors": {
      "description": "Colors for series",
      "type": "array",
      "items": {
        "type": "string"
      }
    }
  },
  "required": [
    "profile",
    "series",
    "columns",
    "private",
    "target"
  ]
}
Reference tree format
FuncTree2 accepts user defined reference trees to be uploaded and used instead of the predefined KEGG and FOAM reference trees. Below are examples in TSV and JSON format.
Tab separated matrix
A tab separated matrix containing the ontology. Each line should start with the highest level of the ontology followed by the rest of the levels all the way down to the leaves. Missing level entries should be replaced by an empty string or a dash ["-", ""]. Optionally, the file could have an annotation section containing labels for the entries. These labels will drawn on top of the visualized entries. Please check the matrix file and the annotated-matrix file for reference.
JSON
Custom reference trees could be uploaded in JSON format and used as a target database in FuncTree2. Below is an example of a valid JSON file and its schema definition.
{
  "entry": "example",
  "name": "Example reference",
  "layer": "root",
  "children": [
  {"entry": "map00010",
  "name": "Name of map00010",
  "layer": "L1",
  "children": [
    {
      "entry": "M00001",
      "name": "Name of M00001",
      "layer": "Module",
      "children": [
        {
          "entry": "K00003",
          "name": "Name of K00003",
          "layer": "gene"
        },
        {
          "entry": "K12407",
          "name": "Name of K12407",
          "layer": "gene"
        }
      ]
    },{
      "entry": "M00002",
      "name": "Name of M00002",
      "layer": "Module",
      "children": [
        {
          "entry": "K00844",
          "name": "Name of K00844",
          "layer": "gene"
        },
        {
          "entry": "K12407",
          "name": "name of K12407",
          "layer": "gene"
        }
      ]
    }
  ]
},{
  "entry": "map00012",
  "name": "Name of map00012",
  "layer": "L1",
  "children": [
    {
      "entry": "M00003",
      "name": "Name of M00003",
      "layer": "Module",
      "children": [
        {
          "entry": "K00844",
          "name": "name of K00844",
          "layer": "gene"
        },
        {
          "entry": "K12407",
          "name": "name of K12407",
          "layer": "gene"
        }
      ]
    },{
      "entry": "M00004",
      "name": "name of M00004",
      "layer": "Module",
      "children": [
        {
          "entry": "K00844",
          "name": "Name of K00844",
          "layer": "gene"
        },
        {
          "entry": "K12407",
          "name": "Name of K12407",
          "layer": "gene"
        }
      ]
    }
  ]
}]
}
{
	"$schema": "http://json-schema.org/draft-07/schema#",
	"title": "reference tree",
	"description": "A FuncTree reference tree",
	"type": "object",
	"required": [
		"entry",
		"name",
		"layer"
	],
	"properties": {
		"entry": {
			"description": "Entry id for example K number or Module ids...",
			"type": "string"
		},
		"name": {
			"description": "The display name of the entry",
			"type": "string"
		},
		"layer": {
			"description": "Layer of the object e.g. KO, Module or Pathway",
			"type": "string"
		},
		"children": {
			"description": "Description of the profile",
			"type": "array",
			"items": {
				"$ref": "#"
			}
		}
	}
}
Viewer
FuncTree
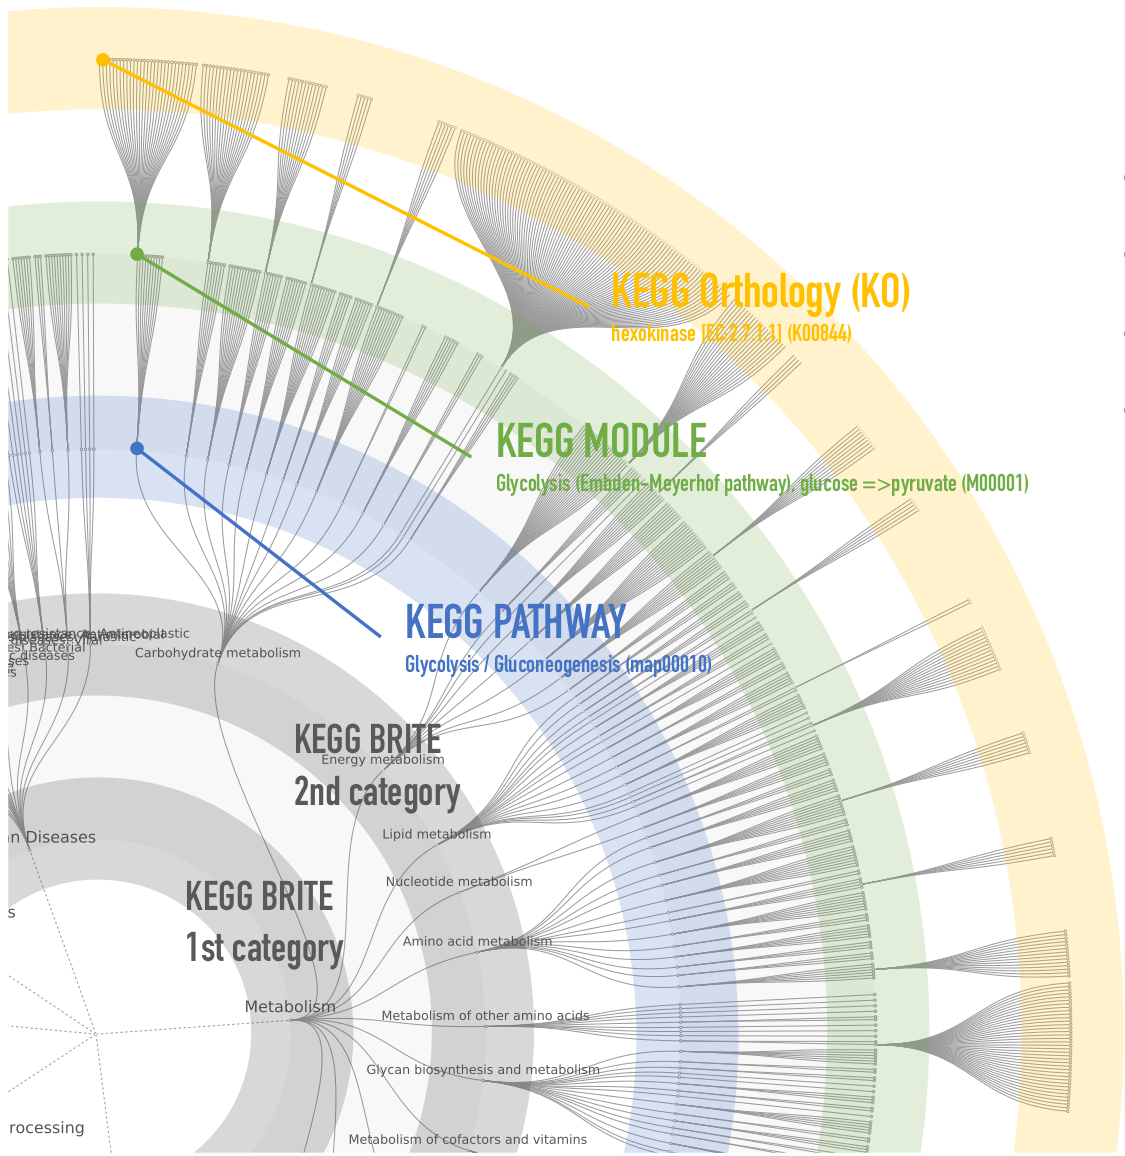
FuncTree explorer turns a hierarchical classification
into an interactive Radial Tidy Tree where each layer of nodes is
mapped to a level of the hierarchy. The outermost layer is always
the lowest level visualized, while the innermost layer is the
highest level, and nodes represent biological entries (e.g. KO,
Modules, pathways, ...).
The four highest levels are shown by default, but more or
less levels could be shown by modifying the depth of the tree in
the option pane. Clicking on a node collapses or reveals its
children nodes, while right-clicking opens a context menu that
offers re-rooting of the tree by visualizing the
selection as a Radial Tidy Tree in a new Viewer window. The menu
can display more details about the selection, copy it to
clipboard, or open it in the KEGG database. Mouse gestures enable zooming (middle button) and panning
(click + drag).
A search with auto-complete is available to help quickly locate a biological entry of interest on
the tree.

Interactive Radial Tidy Tree

Tree re-rooting

Zooming and panning
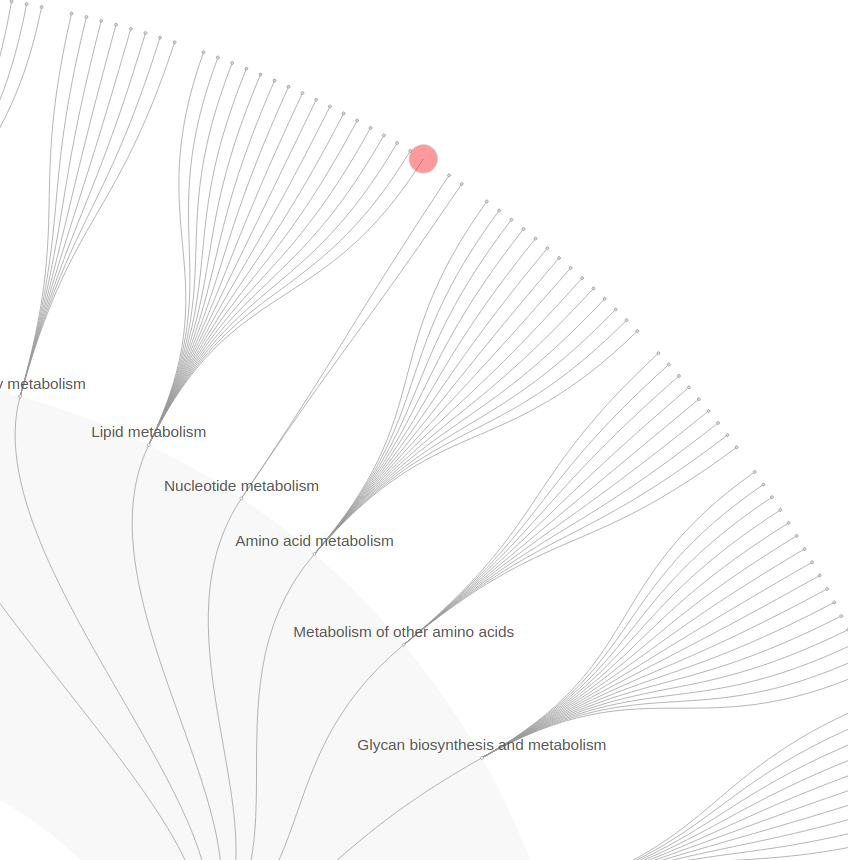
Search & highlight of biological entries
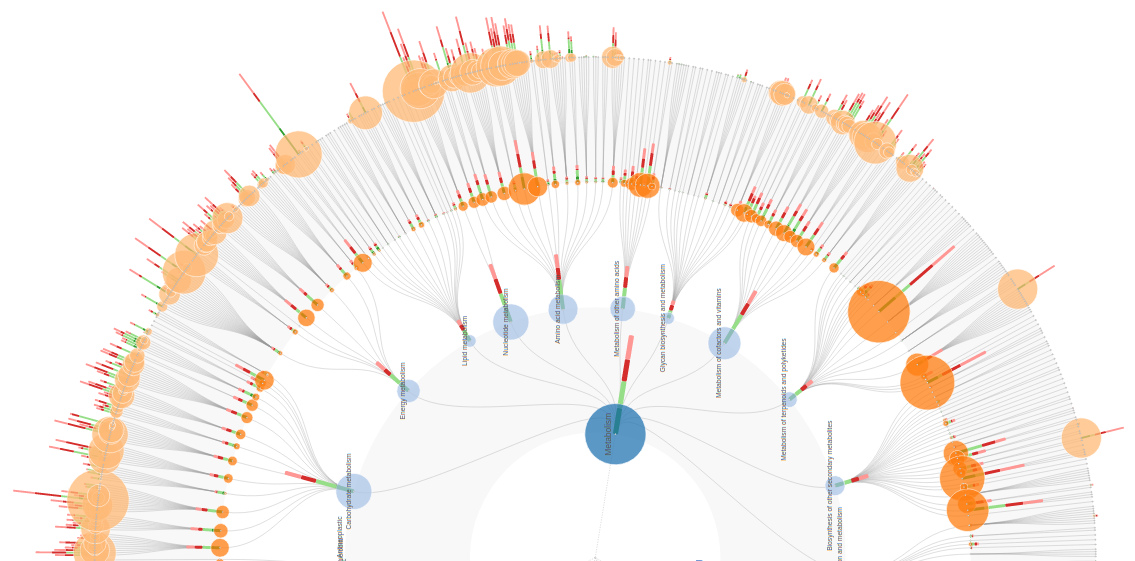
FuncTree viewer is highly customizable to reflect user data. For example KEGG KO abundance from multiple samples is visualized on the KO layer in the form of normalized stacked bars, while the sum across samples in the form of colored circles. Values for higher layers are also derived and visualized in the same fashion.
Data series selection
Data series are profiles that FuncTree can customize and project onto the reference tree. Series generated by FuncTree will always include an Average and a Sum based series. After series selection, you can chose which columns to highlight as stacked bars (optionally normalized aka 100% stacking) on the tree. Additionally, a column of choice can be mapped to the radius of each node. This could be useful for visualizing p-values of an enrichment analysis as circles when abundance is mapped as bars.
Data series generation
FuncTree summarizes KO abundances on higher layers by taking the mean or the sum of the KOs mapped to an entity on the layer.
- Each node abundance is calculated as the mean of its mapped KOs normalized by its KO size.
- In case sum only a sum is applied
- In case of modules the module coverage is visualized, then on parent levels the mean of module coverage is used (without normalization)
Coloring options for circle mapping of one sample
- Layer: Automatically generated colors for Ontology layers e.g. Brite L1, L2, Pathway, Module
- Column: use the color code associated with a sample in the input data
- Entry: Reflect user predefined colors for each entry. Defaults to grey.
Tree export
FuncTrees could be exported into SVG, PDF, PostScript, and PNG
Summary charts
- Stacked barplot
- Normalized Stacked barplot
- Pie chart
- Heatmap
Charts could be exported into SVG, PDF, PNG, and JPEG

Stacked barplot
Data series samples

Stacked barplot 100%
Normalized Data series samples
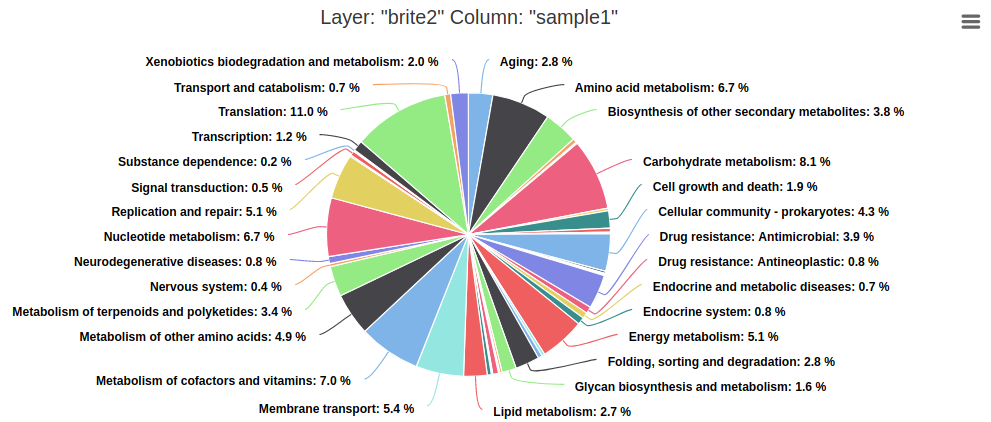
Pie chart
One sample in a data series
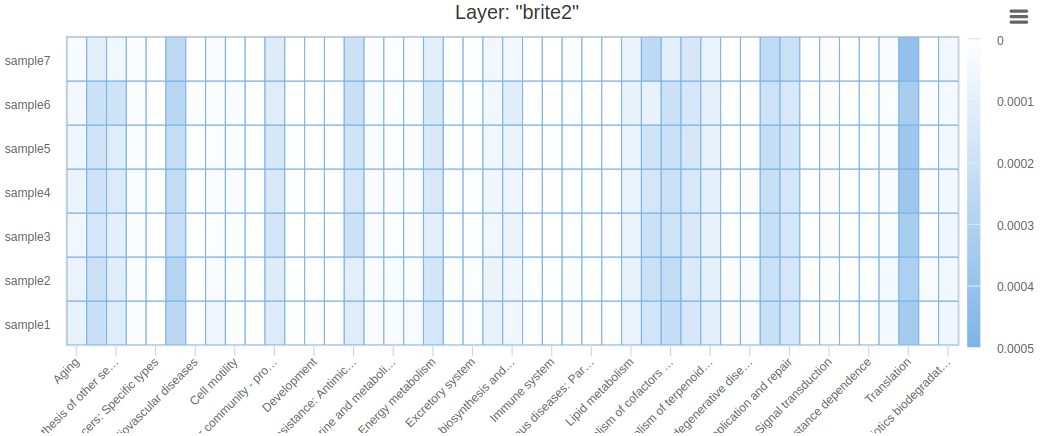
Heat map
Ontology layer vs. Samples of a data series
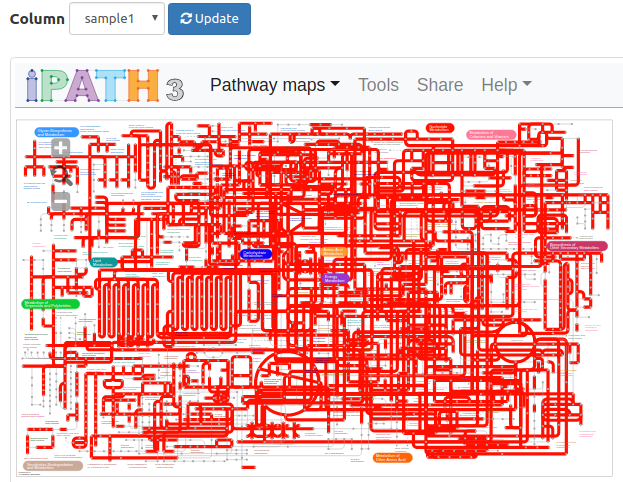
iPath integration
FuncTree can display its data
series or raw input KOs on iPath
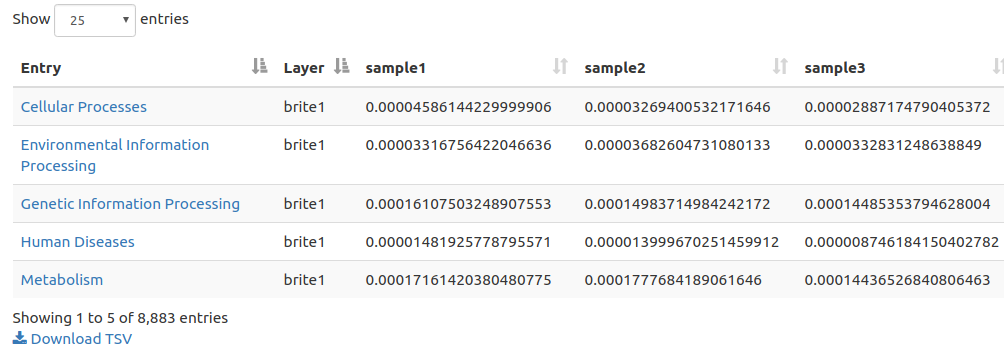
Summary Table
FuncTree nodes of a data series are
presented in the Entry column of the table and given a layer value
and a numerical value for all samples in the series. Download in
TSV format is available for further exploration and manipulation
offline.
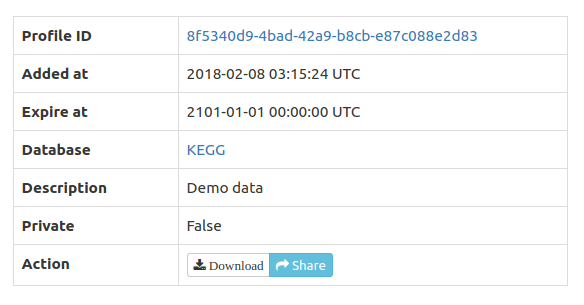
Profile storage, download, and sharing
Profiles are
optionally stored in FuncTree for a period of 30 days and could be
shared by clicking the share icon which copies the share link to
the clipboard and displays it on screen. Alternatively, profiles
could be downloaded in JSON format for permanent storage or
sharing. The display
function allows re-upload and display of the JSON profiles in
FuncTree.
Batch Access
REST
A REST API is available for automated interaction with FuncTree2. All available interactions on the web client are also available in the API.
Map, Compare or Display profiles
To map a profile please edit the bold parts in the command below to match your data. In its current form it will upload the file '/tmp/profile.tsv' and map it to the KEGG tree. The resulting profile will be public with a description that reads "Description of maximum 50 letters". The private and modulecoverage switches could be omitted to keep the profile private and to generate a module coverage entry in the data series (default behavior).
curl -X POST -H "Accept: application/json" -H "content-type: multipart/form-data" \
 	-F 'target=KEGG' \
 	-F 'description="Description of maximum 50 letters"' \
 	-F 'modulecoverage=0' \
 	-F 'private=0' \
 	-F 'input_file=@/tmp/profile.tsv' \
 	https://bioviz.tokyo/functree2/api/mapping/
After a successful upload an id like 807a2d93-3530-4c9a-9aae-ed37d7c93fce will be returned and should be used for further interaction.
If no entries in the uploaded table were mapped to the hierarchy, NO_MATCHED_HIERARCHIES will be returned.
The same logic applies for comparison and display, only the URL is different
- https://bioviz.tokyo/functree2/api/display/
- https://bioviz.tokyo/functree2/api/comparison/
Download of a profile
To download a profile please edit the bold parts in the command below to match your data. In its current form it will download the tree to '/tmp/functree.svg'
curl -X GET -H "Accept: text/svg" \
"https://bioviz.tokyo/functree2/api/viewer/?profile_id=807a2d93-3530-4c9a-9aae-ed37d7c93fce&series=Abundance%20(Mean)&columns=sample1,sample2" \
> /tmp/functree.svg
Arguments that could be used in the query string are the following:
- profile_id (required): the profile id to visualize
- series (required): the series to visualize. Possible values are mean, sum, or modulecoverage unless a json file was uploaded with different names for data series.
- columns: a comma separated list of columns to visualize (e.g. sample1,sample2)
- circle-column: Name of one sample to map as circle on top of the nodes. (e.g. sample3)
- color-code: Only used if circle-column has a value. [Layer, Column, Entry]. Defaults to Layer.
- stack: should 100% stacking be enabled? Should be appended without a value (e.g. &stack)
- disable-normalization: should normalization be disabled? Should be appended without a value (e.g. &disable-normalization)
- depth: depth of tree. Possible values for KEGG hierarchy are [brite0, brite1, brite2, pathway, module, ko]. Defaults to module.